Prove value with six tenant-admin metrics — without leaving Jira.
The renewal question
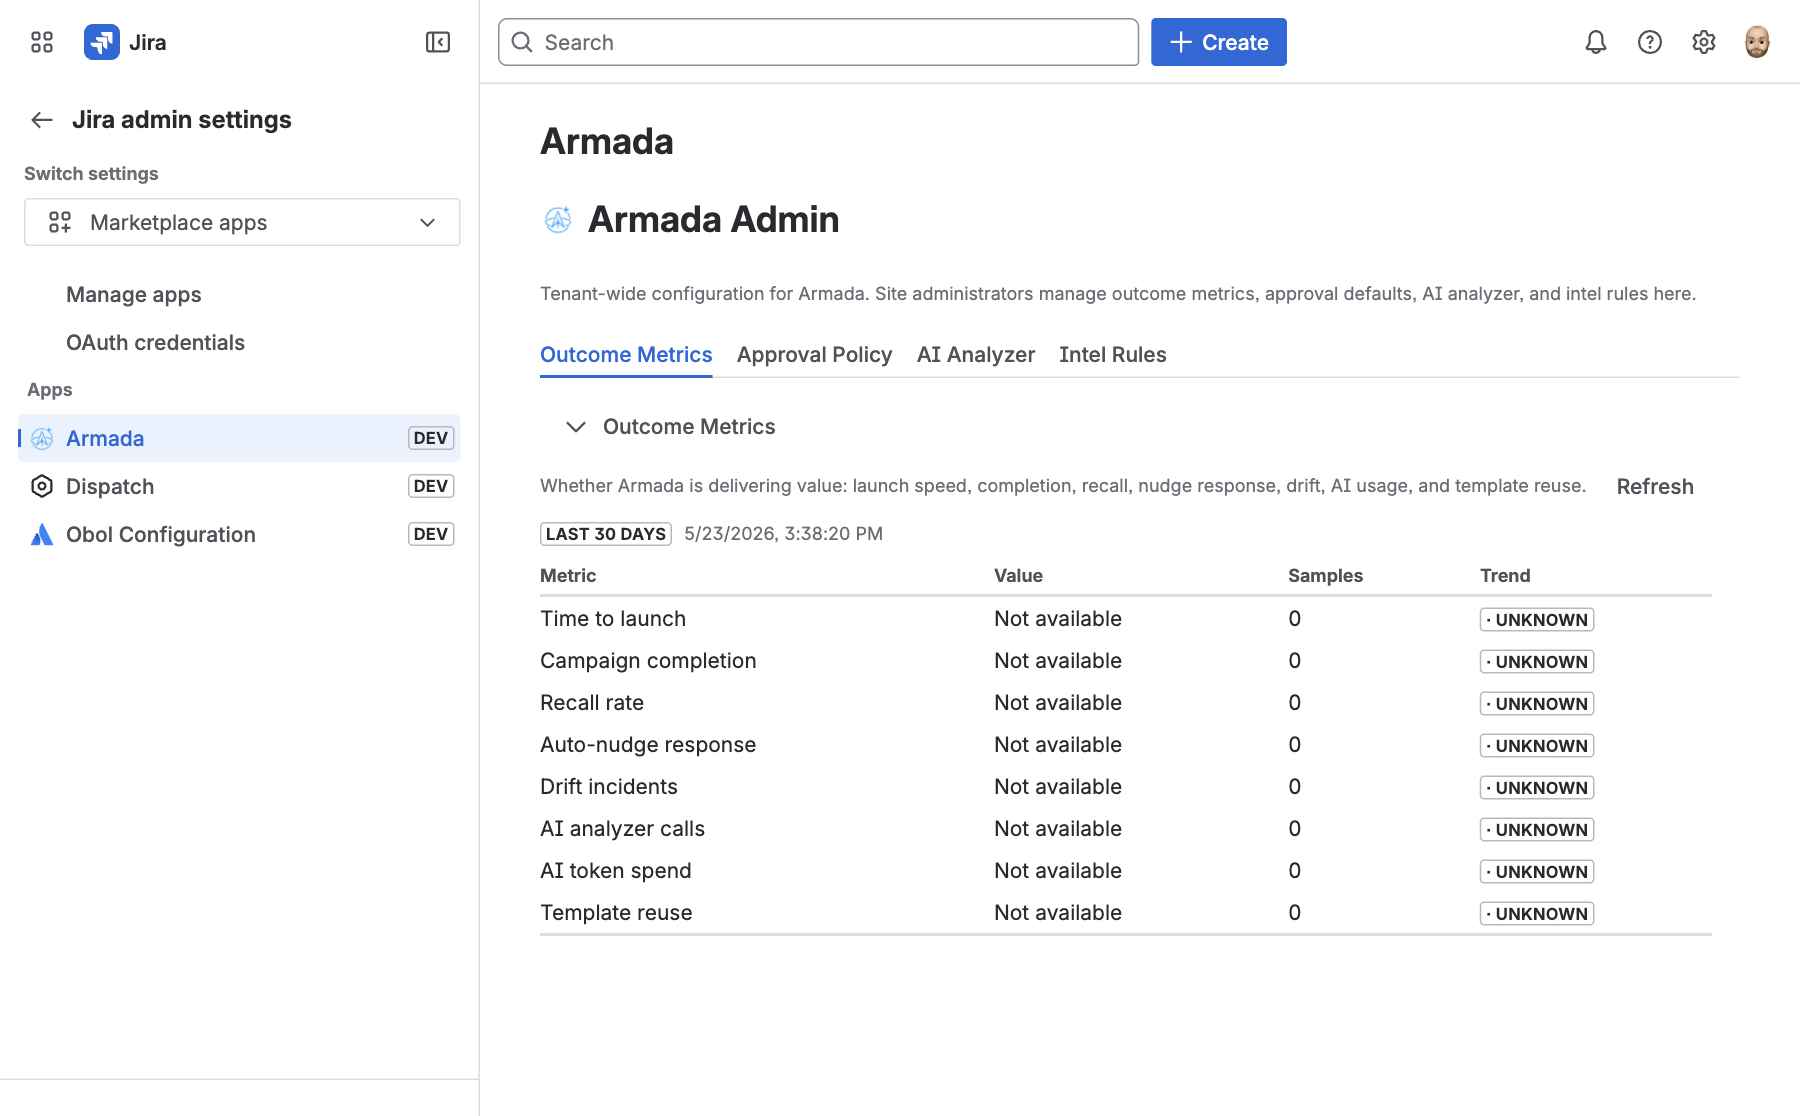
"Is Armada actually delivering value?" is the conversation that decides renewal. Without outcome metrics, the answer is anecdotes. With outcome metrics, the answer is a table: time-to-launch, completion, recall, nudge response, template reuse — derived from real campaign state and persisted events, not from opinions.
What gets measured
Time to launch (minutes) — Median minutes between a campaign's launch event and the first child issue being touched. Lower is better.
Campaign completion (percent) — Percentage of campaigns in the window where at least 80% of children reached Done.
Recall rate (percent) — Percentage of campaigns in the window that ended via recall. A trust signal — lower is stronger.
Auto-nudge response (percent) — Percentage of nudges followed by child issue activity within 48 hours of being sent.
Drift incidents (count) — Drift events per active campaign per window (PROJECT_MISSING, PERMISSION_DENIED, ISSUE_TYPE_MISSING, COMPASS_COMPONENT_DELETED, COMPASS_TEAM_RENAMED).
Template reuse (ratio) — Average number of campaigns instantiated per saved mission template. Higher signals template fitness.
How it works
Tenant-wide rollup. Lives on the Armada admin page in a dedicated tab. Site administrators see all campaigns, all teams, all signals in one window.
Period-over-period trends. Each metric carries a trend lozenge against the immediately preceding window of equal length — direction-aware (lower recall rate = UP trend; higher completion = UP trend).
Real events, 90-day retention. A chunked Forge Storage event log (RECALL, NUDGE_SENT, TEMPLATE_INSTANTIATION) is appended at the operation seam and pruned daily.
Operator rollup on Compass. A compact card on the Compass global page surfaces campaign completion and recall rate so operators (not just site admins) see tenant outcome at a glance.
armada · admin / outcome-metrics
Where it shows up
Admin page — the full table with sample sizes and trends. Window selector (7 / 30 / 90 days / all time).
Compass global page — compact completion and recall card for operators.
Audit log — every metric read is audited (event:audit.access.outcome_metrics) with actor, time, and window. See theAudit Log page.
Privacy and access
Outcome metrics are admin-gated server-side via isJiraAdmin. Non-admin reads are rejected and audited as outcome=blocked. Metrics do not include personally identifying content from issues — just aggregate counts and percentages.